Why Order Flow Matters
The market is a continuous two-sided auction. Every transaction requires a buyer and a seller. Price moves when one side becomes more aggressive than the other — when buyers lift the ask faster than sellers can supply, price goes up. When sellers hit the bid faster than buyers can absorb, price goes down.
Order flow is the real-time record of that activity. It shows you which side is in control right now, whether they're gaining or losing momentum, and whether a move is supported by real participation or running out of fuel. You can't see any of that on a standard candlestick chart. You need the footprint.
What You Cannot See in a Candle
A standard candlestick gives you four data points: open, high, low, close. That is the result of whatever happened inside that candle. A footprint chart splits that same candle by price level — showing you exactly how many contracts traded at the bid versus the ask at every tick. The candle is the scoreboard. The footprint is the game tape.
| Price | Bid | Ask | Delta |
|---|---|---|---|
| 4502.25 ← High | 489 | 194 | −295 IMBAL |
| 4502.00 | 341 | 187 | −154 |
| 4501.75 | 212 | 198 | −14 |
| 4501.50 ← Close | 178 | 203 | +25 |
| 4500.25 | 134 | 312 | +178 |
| 4500.00 ← Open | 98 | 421 | +323 IMBAL |
| 4499.75 ← Low | 87 | 309 | +222 IMBAL |
The Three Active Tools
The footprint breaks every candle down by price level — how many contracts traded on the bid (sellers) and ask (buyers). Every order flow tool derives from this raw data. I run three of them live. Below those three are the reference concepts every trader should understand — but they don't need to be on your screen to trade well.
| Price | Bid Vol | Ask Vol | Delta |
|---|---|---|---|
| 7498.00 | 156 | 521 | +365 |
| 7497.75 | 203 | 287 | +84 |
| 7497.50 | 341 | 318 | −23 |
| 7497.25 | 489 | 201 | −288 |
| 7497.00 | 612 | 198 | −414 |
| 7496.75 | 187 | 156 | −31 |
Stacked imbalances at 7497.25 and 7497.00 — sellers in control at those two levels despite price sitting at the top of the candle range.
My Approach — Less Is More
Order flow platforms like NinjaTrader's Order Flow Trader come loaded with indicators. Between footprint metrics, delta calculations, volume analysis tools, and custom studies, you can easily have 20 or 30 tools available to you. Most of them are legitimate. Most of them are also unnecessary if you're running a confirmation-based system.
I have access to over 26 order flow tools inside my platform. In live trading, I run three. Delta, Delta Change, and Stopping Volume. That's the stack. Everything else is available, none of it is needed for what I'm doing.
Here's why: every tool you add is a filter. More filters mean more things that have to line up before you act. On a fast market, that hesitation costs you the trade. On a slow market, it generates false negatives — setups that were real but got screened out because one of your seven indicators didn't cooperate. The 6-Gate system already handles most of the context — price structure, cloud direction, market profile levels. By the time you're reading the footprint, you need confirmation, not another analysis layer.
Running fewer tools also forces you to understand what each one is actually measuring. Most traders don't know what cumulative delta means at a mechanical level. They see a number, they don't know if it's meaningful. When you strip everything down to three tools and work with them daily, you stop looking at numbers and start reading them.
Live Example — ATH Rollover Read
The sequence below shows how order flow reads unfold in real time on the S&P 500 futures at an all-time high. This is the kind of setup where most traders see new highs and either freeze or buy the breakout. Order flow told a different story before the move gave it away.
How the Read Unfolds
- Price reaches a pre-marked confluence zone (Zone A or Zone B, Fib level, VWAP overlap) — Gate 3 passed
- Open the footprint at that level. Look at delta at each price row. Is one side absorbing?
- Watch delta change bar-to-bar. Is momentum building in the trade direction or fading against you?
- Stopping volume spike at the level = institutional participation confirmed. Gate 4 passed.
- Drop to 1000-tick. Wait for the 21 EMA cross or bounce with a conviction candle. EMA slope must agree.
- Delta change flips at the level — do not wait for candle close. Gate 5 passed. Gate 6: execute.
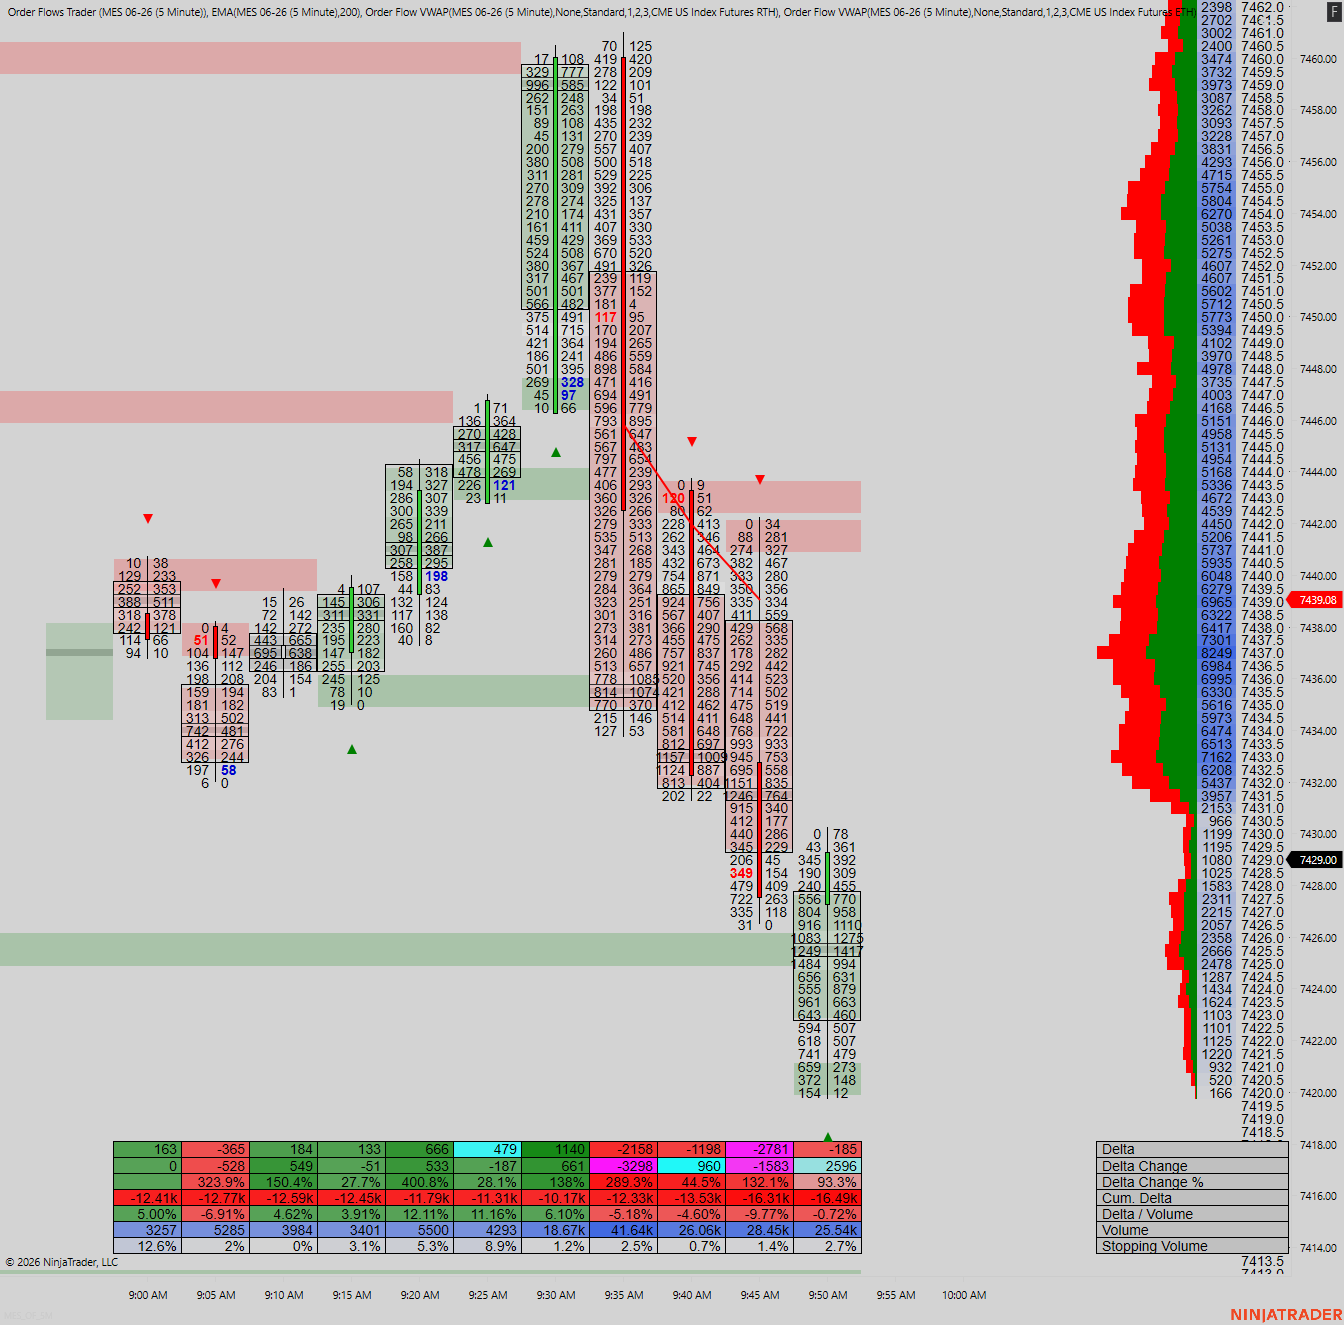
MES 5-Min Footprint
Gate 4 — Absorption / Stopping Volume
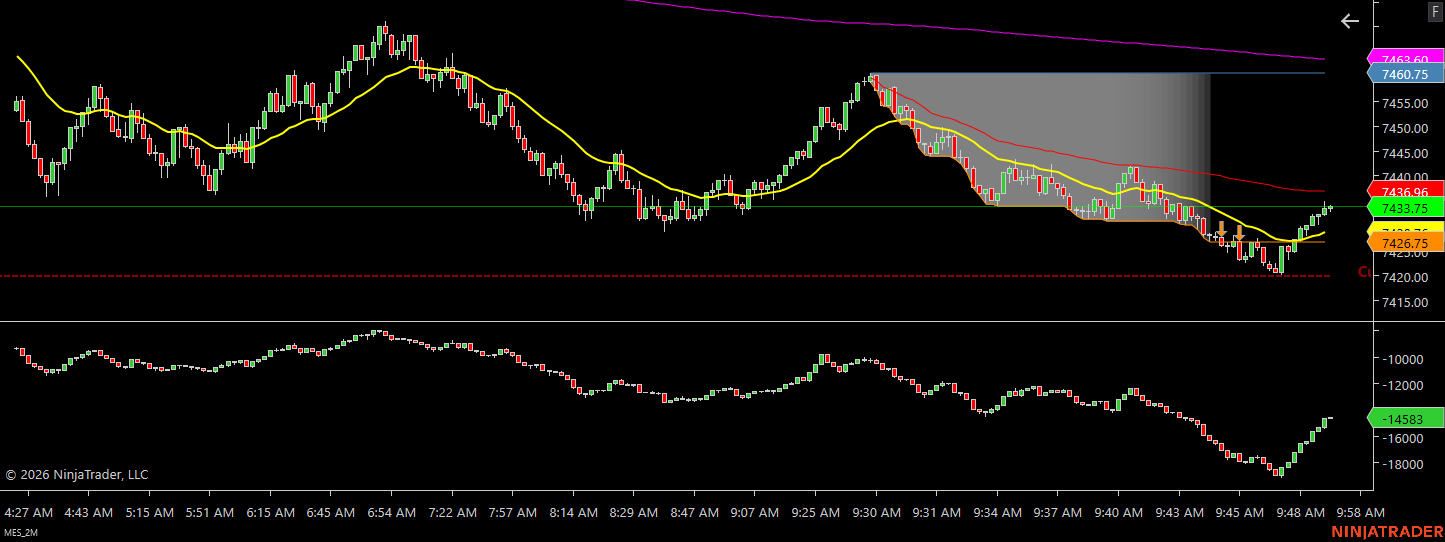
MES 1000-Tick
Gate 5 — 21 EMA Entry Trigger
The Lesson
A new all-time high is not a reason to buy. It's a reason to watch the order flow. If the buyers who pushed price to that level are no longer supporting it — if delta is diverging, if stopping volume is appearing at the highs, if the profile is printing a P-shape — that high is a sell, not a buy. Order flow tells you which one it is before the candle closes.
How Order Flow Fits the 6-Gate System
Order flow lives in Gates 4 and 5 of the 6-Gate confirmation system. By itself, it is context. Combined with the other gates, it becomes confirmation. Gate 4 tells you whether the level is real. Gate 5 tells you when to enter.
SPY Cloud Direction
Establishes the macro bias via Ichimoku cloud on SPY. Above cloud = bullish, below = bearish. Order flow should confirm this direction, not contradict it.
15-Min Price Structure
Higher highs / higher lows or lower highs / lower lows. Structure confirms the intermediate trend. Order flow confirms the participants behind it.
Confluence Zone
Price at a key pre-marked level — Fibonacci, VWAP, Market Profile VAH/VAL/POC. This is where order flow becomes relevant. At random prices, order flow is noise. At key levels, it's the signal.
Order Flow Confirms — The Edge Gate
Footprint at the confluence zone. You're looking for one or more of: absorption (high volume, price not moving), stopping volume (large spike where direction changes), delta diverging from price, or stacked imbalances at the level. This is where the trade earns its entry or gets scrapped. Without Gate 4, you have a location. With Gate 4, you have a trade with a reason behind it. Delta change flipping at a pre-marked level = trigger. Do not wait for candle close.
21 EMA on 1000-Tick — Entry Trigger
Price crosses or bounces off the 21 EMA with a conviction candle. EMA slope agrees with direction. Gate 4 confirmed the thesis. Gate 5 confirms the timing. Both required. Gate 4 without Gate 5 = good read, bad entry. Gate 5 without Gate 4 = entry with no confirmation. Far from EMA, EMA opposing, or weak candle = do not enter.
Execute Without Hesitation
Four or more gates confirmed = execute immediately. Order flow was the confirmation that earned this trigger. The decision was made at Gate 4. Gate 6 is the action, not the analysis.
Every gate, every pass/fail condition, risk management rules, tick tables, execution rules. Free — sign up on the home page to get the link.
Market Profile — Gates 3 and 4 context → market-profile.html
Acronym Reference
Every order flow term used on this page and in live sessions — defined in plain English. The Uses column shows which tools are in the active live-trading stack.
| Acronym | Full Name | Definition | Uses |
|---|---|---|---|
| DELTA | Delta | Ask volume minus bid volume. Positive = buyers more aggressive. Negative = sellers more aggressive. The net score of the auction. | ✓ Active |
| Δ CHANGE | Delta Change | The change in delta from one bar to the next. Measures whether buying or selling pressure is accelerating or fading. | ✓ Active |
| STOP VOL | Stopping Volume | A large volume spike at a level where price stops moving in one direction. Signals institutional participation taking the other side of the flow. | ✓ Active |
| CVD | Cumulative Volume Delta | Running total of delta across time. Divergence between CVD and price is one of the highest-signal setups in order flow. | Reference |
| DELTA VOL | Delta Volume | Total volume behind the delta calculation. High delta volume at a key level = institutional participation. Low volume = noise. | Reference |
| MIN Δ | Min Delta | Maximum selling pressure within a candle. If large negative Min Delta didn't push price lower — that level was defended. | Reference |
| MAX Δ | Max Delta | Maximum buying pressure within a candle. If large positive Max Delta didn't push price higher — buyers got absorbed. | Reference |
| BID VOL | Bid Volume | Contracts traded at the bid — aggressive sellers accepting the lower price. High bid volume = selling pressure at that level. | Reference |
| ASK VOL | Ask Volume | Contracts traded at the ask — aggressive buyers lifting the offer. High ask volume = buying pressure. | Reference |
| IMBAL | Imbalance | When one side outweighs the other by 3:1 or more at a price level. Stacked imbalances signal institutional directional activity. | Reference |
| ABX | Absorption | Large hidden orders absorbing incoming flow without price moving. When the opposing side exhausts itself, price moves fast. | Reference |
| HVN | High Volume Node | A price with abnormally high volume on the profile. Price slows, rotates, or reverses at HVNs. | Reference |
| LVN | Low Volume Node | A price with minimal volume. Price moves through LVNs quickly in both directions — air pockets. | Reference |
| BEAR DIV | Bearish Divergence | Price making new highs while CVD is declining. Buyers losing participation. Reversal signal when found at a key level. | Reference |
| BULL DIV | Bullish Divergence | Price making new lows while CVD is rising. Sellers losing participation. Reversal signal when found at a key level. | Reference |
| STACK | Stacked Imbalance | Multiple consecutive imbalances in the same direction. Strongest imbalance signal — indicates institutional directional conviction. | Reference |
| FAILED ABX | Failed Absorption | Absorption was occurring at a level and the level broke anyway. Fast, aggressive directional move follows. | Reference |
| MAE | Maximum Adverse Excursion | The maximum drawdown a trade reached before reversing. Used to calibrate stop placement against actual trade behavior. | Reference |
| MFE | Maximum Favorable Excursion | The maximum unrealized gain a trade reached. Used to calibrate target placement and trailing stop logic. | Reference |
"The market is not random. Every candle, every level, every move has a participant behind it — a buyer, a seller, an institution defending a position or initiating a new one. Order flow is how you see them. Not perfectly. Not always. But clearly enough to stop trading blind."